echarts配置图例和颜色渐变
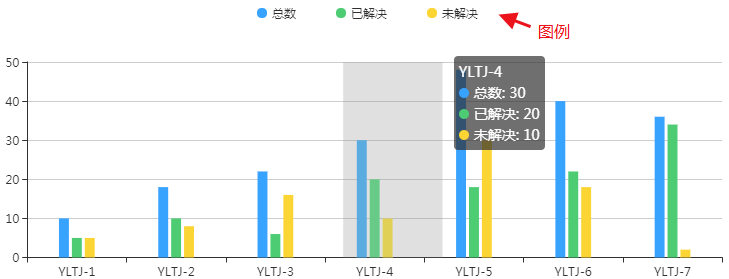
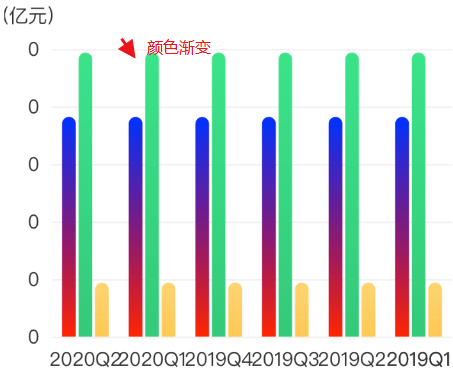
在使用echarts时,默认的图例效果和UI设计稿的效果相差甚远就要我们自己去配置下,还有默认效果也是单色不好看,u设计出来大多数是渐变色的效果比较炫酷些,echarts如何配置图例和颜色渐变呢?很简单哦,直接看例子有图有代码,复制黏贴下改成你要的参数就行了。
1.echarts配置图例

legend:{
 icon: 'roundRect', // 'circle', 'rect', 'roundRect', 'triangle', 'diamond', 'pin', 'arrow'
 itemWidth: 16, // 设置图例宽度
 itemHeight: 16, // 设置图例高度
 itemGap: 50, // 设置图例间距
 textStyle:{
   color: '#ffffff'
 },
 top: '2%',
 left: '46%'
},2.echarts配置颜色渐变

series: [{
 name: '总数',
 type: 'bar',
 data: this.rows.yAxis,
 itemStyle: {
  color: new this.$echarts.graphic.LinearGradient(
      0, 0, 0, 1,
    [
     {offset: 0, color: '#19AFFF'}, // 0% 处的颜色
     {offset: 1, color: '#0080C4'}  // 100% 处的颜色
    ]
  ), //渐变色
  barBorderRadius: [79, 79, 0, 0] //圆角
}, 除注明外的文章,均为来源:老汤博客,转载请保留本文地址!
原文地址:https://tangjiusheng.cn/js/206.html
原文地址:https://tangjiusheng.cn/js/206.html

