echarts多条折线图渲染(多条折线绘制方法附实例代码)
作为前端开发人员都知道常用的echarts基于html5 Canvas是一个纯Javascript图表库,提供直观,生动,可交互,可个性化定制的数据可视化图表。我们可以用echarts绘制出很多酷炫的图表,下面手把手的教你绘制echarts多条折线图渲染方法附实例代码。
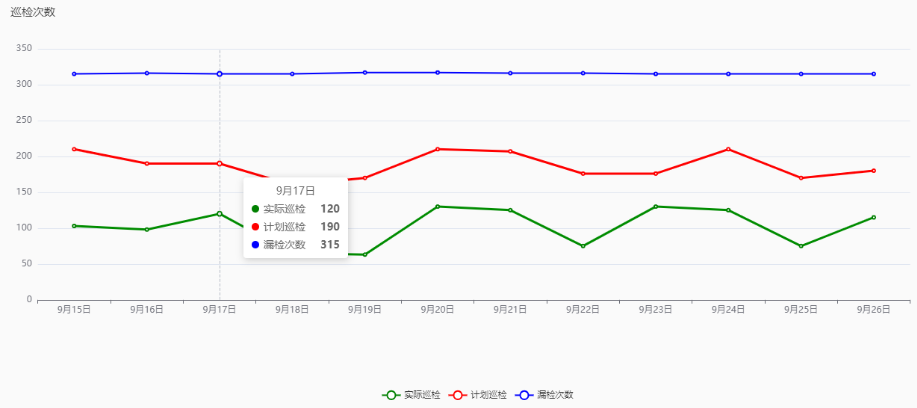
多条折线效果如下图:

首先需要引入echarts哦
1、定义一个div
这里的height就是y轴的高度了~
<div style="width: 100%; height: 600px" ref="chart"></div>
2、定义一个方法init
在mounted引用
mounted() {
 this.init()
},
3、定义数据
这个一般是后台给的接口的数据,我这里是模拟的哦~
let lineData = {
  x: [
    '9月15日',
    '9月16日',
    '9月17日',
    '9月18日',
    '9月19日',
    '9月20日',
    '9月21日',
    '9月22日',
    '9月23日',
    '9月24日',
    '9月25日',
    '9月26日',
  ],
  y_green: [103, 98, 120, 65, 63, 130, 125, 75, 130, 125, 75, 115],
  y_red: [210, 190, 190, 160, 170, 210, 207, 176, 176, 210, 170, 180],
  y_blue: [315, 316, 315, 315, 317, 317, 316, 316, 315, 315, 315, 315],
}
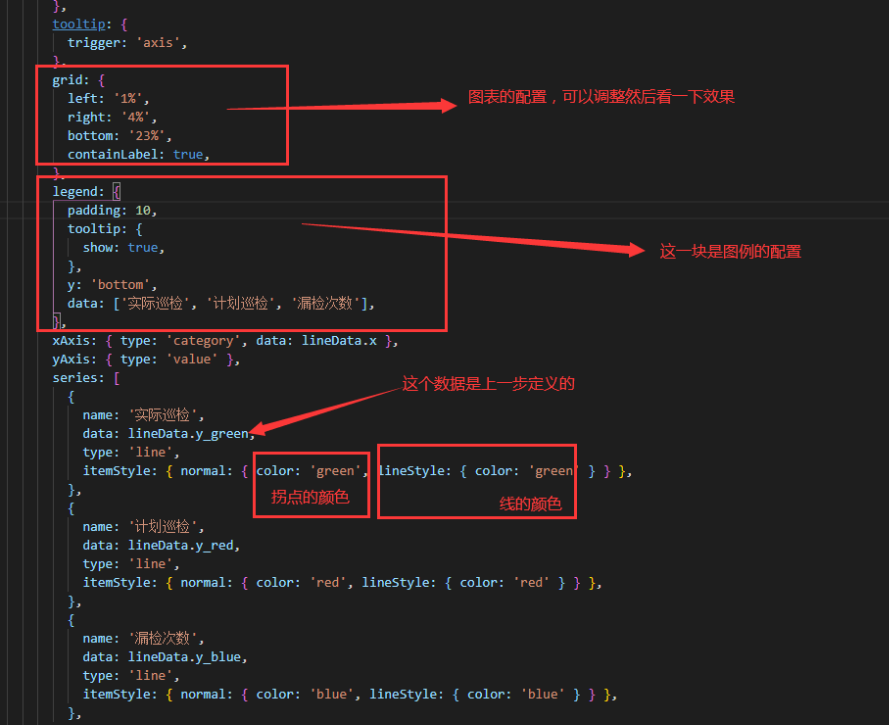
4、echarts多条折线图渲染实例代码如下:
const option = {
  title: {
    text: '巡检次数',
    x: 'left',
    textStyle: {
      fontSize: 15,
      fontStyle: 'normal', // 主标题文字字体的风格。 'normal'  'italic'  'oblique'
      fontWeight: 'normal', // 主标题文字字体的粗细。 'normal' 'bold'  'bolder'  'lighter' 500|600
    },
  },
  tooltip: {
    trigger: 'axis',
  },
  grid: {
    left: '1%',
    right: '4%',
    bottom: '23%',
    containLabel: true,
  },
  legend: {
    padding: 10,
    tooltip: {
      show: true,
    },
    y: 'bottom',
    data: ['实际巡检', '计划巡检', '漏检次数'],
  },
  xAxis: {
    type: 'category',
    data: lineData.x
  },
  yAxis: {
    type: 'value'
  },
  series: [{
      name: '实际巡检',
      data: lineData.y_green,
      type: 'line',
      itemStyle: {
        normal: {
          color: 'green',
          lineStyle: {
            color: 'green'
          }
        }
      },
    },
    {
      name: '计划巡检',
      data: lineData.y_red,
      type: 'line',
      itemStyle: {
        normal: {
          color: 'red',
          lineStyle: {
            color: 'red'
          }
        }
      },
    },
    {
      name: '漏检次数',
      data: lineData.y_blue,
      type: 'line',
      itemStyle: {
        normal: {
          color: 'blue',
          lineStyle: {
            color: 'blue'
          }
        }
      },
    },
  ],
}
除注明外的文章,均为来源:老汤博客,转载请保留本文地址!
原文地址:https://tangjiusheng.cn/js/737.html
原文地址:https://tangjiusheng.cn/js/737.html

